Master Gold Trading
Free foundational education and premium masterclasses
Introduction to Gold Trading
Learn the fundamentals of gold market structure, why gold moves, and how to read price action. No credit card required.
The LFT System Masterclass
Complete methodology breakdown: setup identification, entry timing, risk management, and trade execution.
Advanced Technical Analysis
Deep dive into institutional-level analysis: order blocks, volume profiles, multi-timeframe confluence.
The Statistics Behind the Strategy
Learn to read and interpret backtested performance data
6-Month Rolling Sharpe Ratio
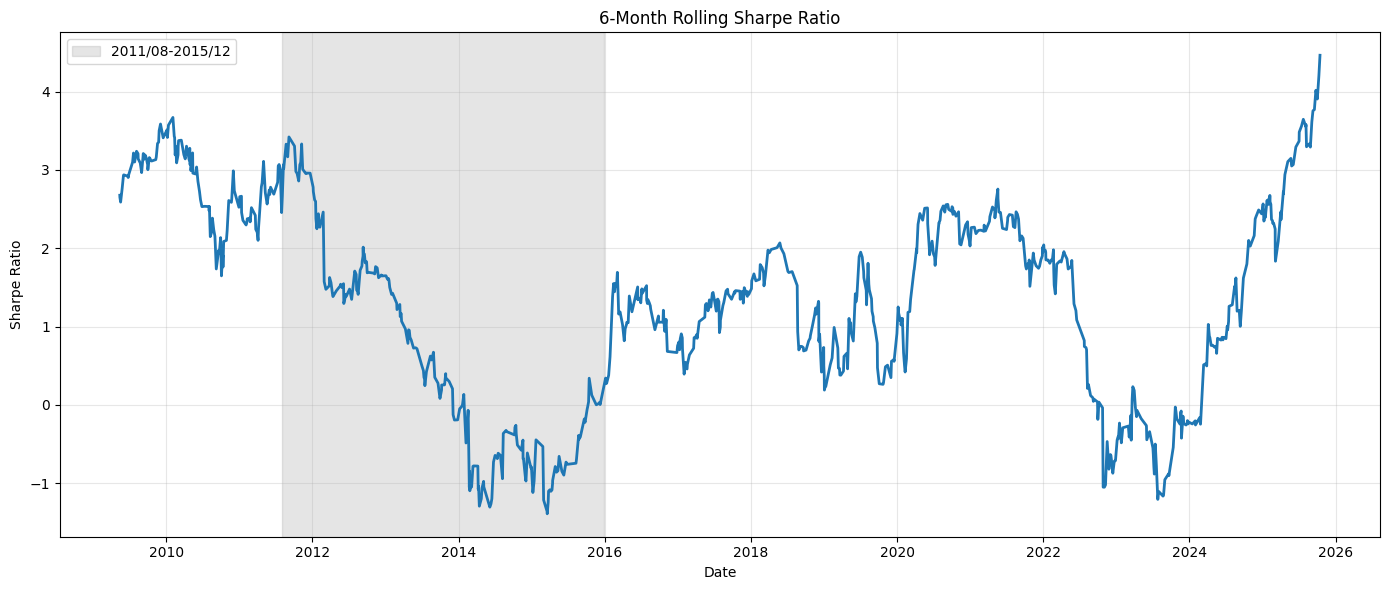
Sharpe ratio measures risk-adjusted returns. Values above 1.0 are good, above 2.0 are excellent. This rolling calculation shows consistency over time—not just cherry-picked periods.
Equity Curve with Risk Bands
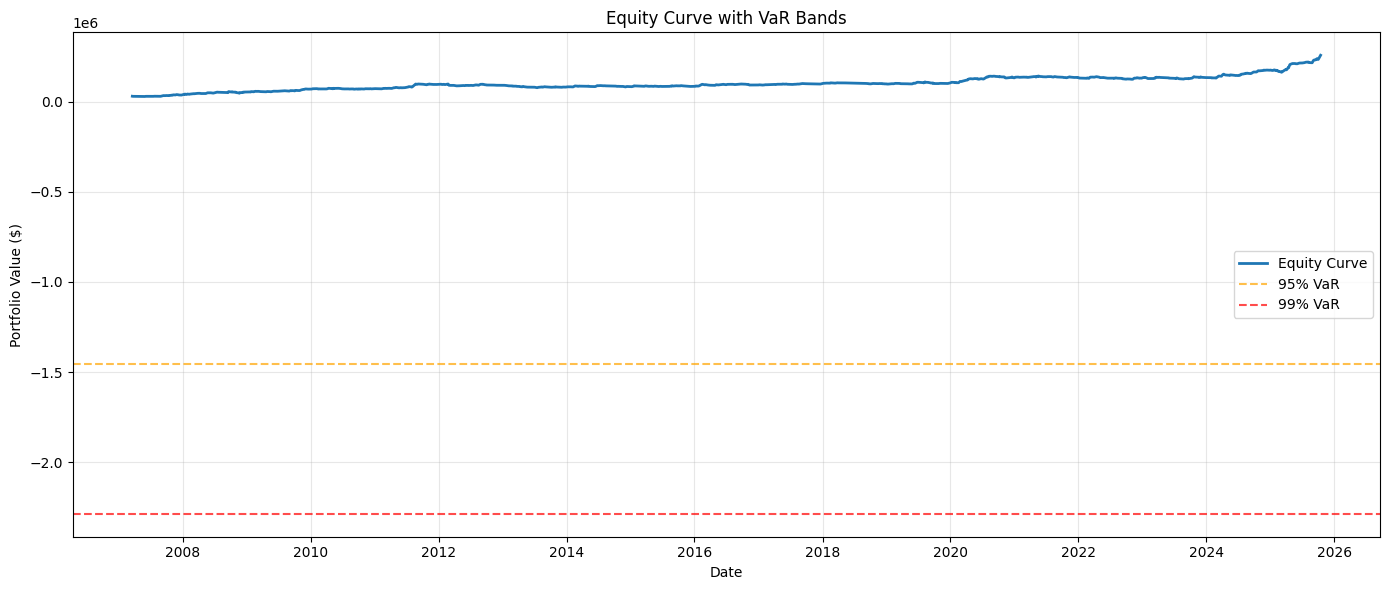
The blue line shows portfolio value growth. The orange/red bands show VaR (Value at Risk)—statistical estimates of potential losses. Understanding risk is as important as understanding returns.
Waterfall Chart: Wins vs Losses
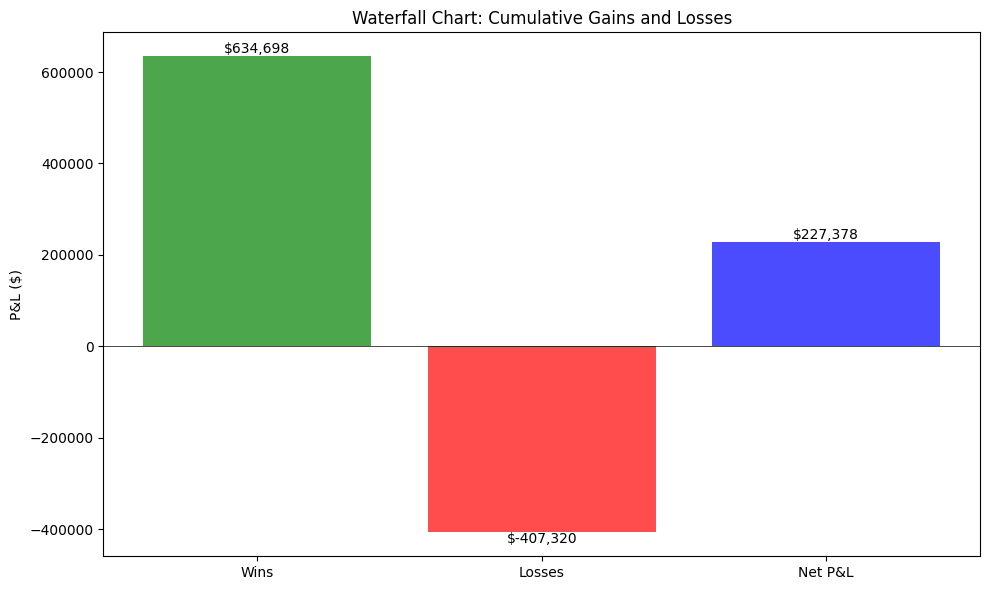
This breaks down total performance into components: gross wins, gross losses, and net result. A healthy strategy has larger average wins than average losses.
Understanding Sharpe Ratio
The Sharpe Ratio is one of the most important metrics in trading, yet most traders don't understand what it actually tells you.
What It Measures
The Sharpe Ratio measures risk-adjusted returns. Anyone can make money in a bull market. The real question is: how much risk did you take to earn that return?
The Formula
In plain English: How much extra return did you earn per unit of risk?
What the Numbers Mean
- < 0.5:Poor risk-adjusted performance
- 0.5 - 1.0:Acceptable, but room for improvement
- 1.0 - 2.0:Good risk-adjusted returns
- >2.0:Excellent—institutional quality
Why This Matters for Gold Trading
Gold is volatile. A system that makes 50% in a year with wild swings (low Sharpe) is less valuable than a system that makes 30% smoothly (high Sharpe). The LFT system prioritizes consistency over excitement.
This is just one lesson from our free Introduction to Gold Trading course. Access the full course to learn position sizing, risk management, and market structure fundamentals.
Start Your Free Education Today
No credit card. No commitment. Just professional-grade trading education.