LFT Algorithm Performance
18+ years of simulated trading results on historical gold market data
Important Disclaimer
Past performance is not indicative of future results. All data represents historical backtesting on simulated trades, not actual trading results. Trading involves substantial risk of loss.
2007-03-19 to 2025-10-14
Total Trades
Executed over all time
Win Rate
Percentage of profitable trades
Sharpe Ratio
Risk-adjusted return measure
Profit Factor
Gross profits / gross losses
Max Drawdown
$6300 peak-to-trough decline
Avg Trade Length
Low-frequency trading approach
Monthly Mean P&L
Average profit per month
Simulated Investment Growth
$30,000 hypothetical starting capital
Backtested Simulation
BACKTESTED SIMULATION
BACKTESTED SIMULATION
BACKTESTED SIMULATION
Advanced Risk Metrics
Detailed statistical analysis of trading performance
Distribution Metrics
Risk-Adjusted Performance
Deeper Performance Insights
Additional visualizations from our backtested data
Drawdown Analysis
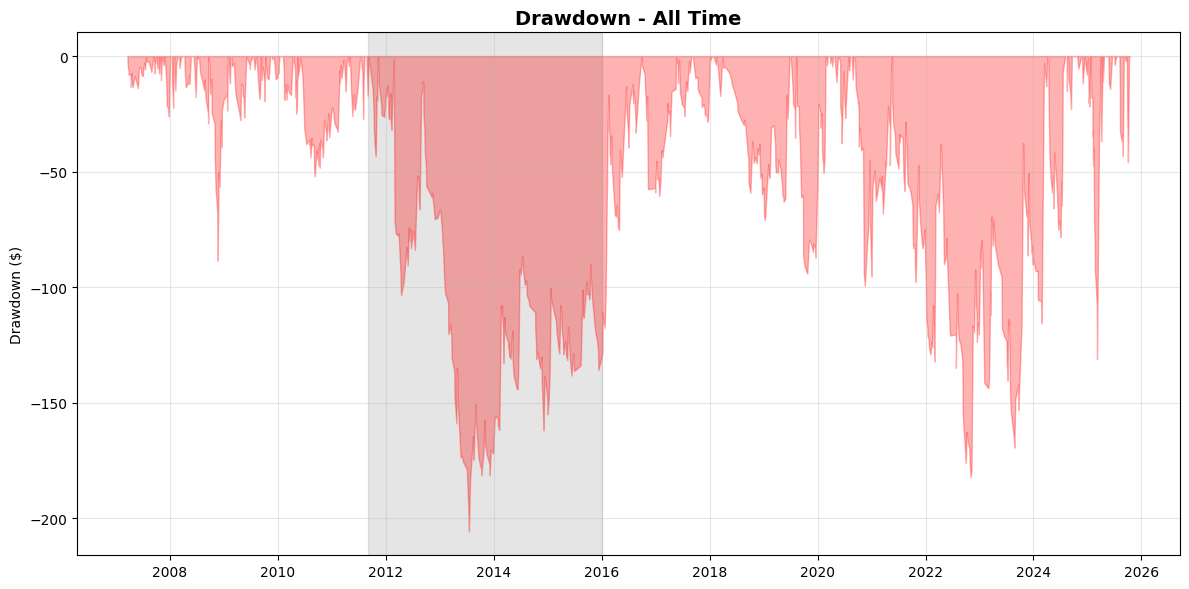
Drawdown measures how far the account value fell from its highest point before recovering. The red area shows temporary losses. Maximum drawdown of 21% means the worst peak-to-valley decline was $6,300 on $30,000 capital. Smaller drawdowns indicate more stable returns with less emotional stress.
Monthly Performance Heatmap
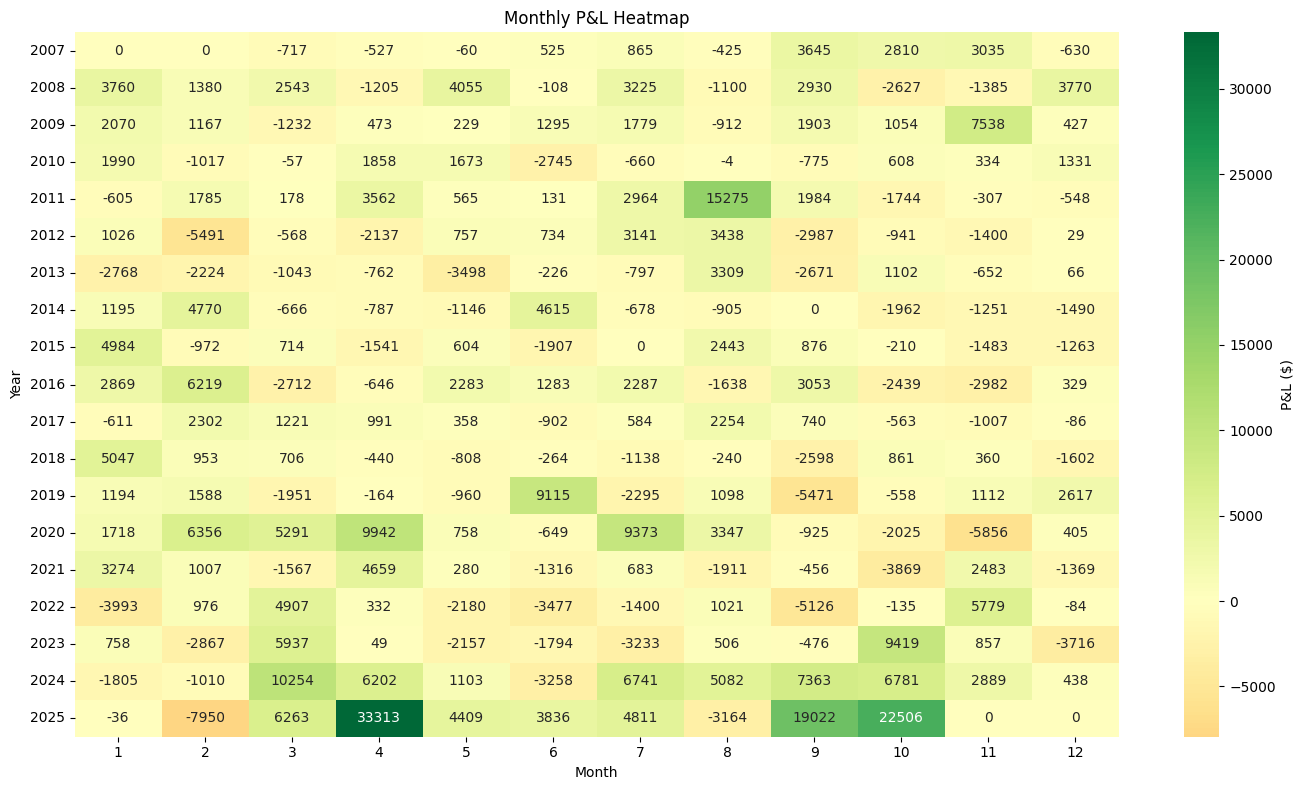
Calendar view showing winning and losing months. Green = profit, Red = loss. Quickly see seasonal patterns.
Distribution Consistency
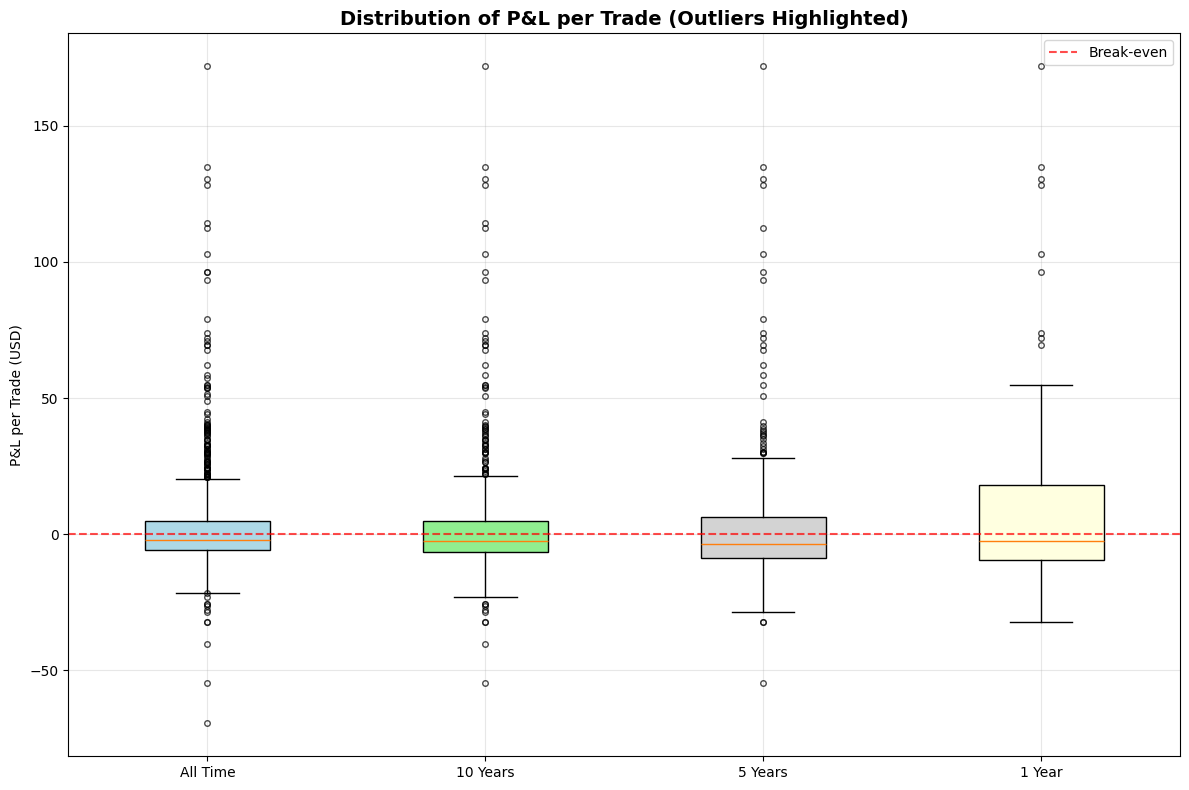
Box plots show the distribution of trade results. The box represents the middle 50% of trades (from 25th to 75th percentile). The line inside is the median. Whiskers show the normal range, and dots are outliers. Tighter boxes mean more consistent performance with fewer extreme outcomes.
Understanding the Strategy
Why We Built This
Most indicators are made for stocks. They don't work well for gold.
Gold moves based on the dollar, inflation data, and Fed policy—not earnings reports or company news.
We built these indicators specifically for gold futures. Every signal is calibrated for how gold actually trades.
Frequently Asked Questions
Ready to Learn the Strategy?
These results represent backtested simulations. Start with free education to understand the methodology.
Disclaimer: Past performance is not indicative of future results. All data represents historical backtesting on simulated trades, not actual trading results. Trading involves substantial risk of loss.